Loading...
Loading...
Loading...
Loading...
Loading...
Loading...
Loading...
Loading...
Loading...
Loading...
Loading...
Loading...
Loading...
Loading...
Loading...
Loading...
Loading...
Loading...
Loading...
Loading...
Loading...
Loading...
Loading...
Loading...
Loading...
Loading...
Loading...
Loading...
Loading...
Loading...
Loading...
Loading...
Loading...
Loading...
Loading...
Loading...
Loading...
Loading...
Loading...
Loading...
Loading...
Loading...
Loading...
Loading...
Loading...
Loading...
Loading...
Loading...
Loading...
Loading...
Loading...
Loading...
Loading...
Loading...
Loading...
Loading...
Loading...
Loading...
Loading...
Loading...
Loading...
Loading...
Loading...
Loading...
Loading...
Loading...
Loading...
Loading...
Loading...
Loading...
Loading...
Loading...
Loading...
Loading...
Loading...
Loading...
Loading...
Loading...
Loading...
Loading...
Loading...
Loading...
Loading...
Loading...
Loading...
Loading...
Loading...
Loading...
Loading...
Loading...
Loading...
Loading...
Loading...
Loading...
Loading...
To schedule time with your Consultant or Project Manager, you can access their calendars to see availability and eliminate back and forth email.
Access the TM team member's calendar
Option A: Click on the Book My Calendar link in the persons email signature.
Option B: Log in to Klient and open the task associated with your meeting request. For example, 6.1 HR Preview of Survey Results. Click on the meeting link provided.
Select the meeting option that best fits your needs.
Note that an Executive Consultants calendar may require you to choose three time options. The first time selected is usually confirmed, but having alternative options is always beneficial.
IMPORTANT: Add meeting details to your request.
An email confirmation will be sent to you, at the address provided, to confirm your meeting.
TalentMap recommends using a 5 point Likert response scale that ranges from "Strongly Disagree to Strongly Agree." The scale allows for a neutral response in the middle of the scale, and to provide for enough detail without overwhelming the respondent with choices.
We use a five point scale because it is short, easy to understand, economizes on space and it is the most widely used survey scale in employee opinion surveys. Furthermore, research shows there is no significant difference between survey results that used either a 5-point, 7-point or 10-point scale.
A study in the International Journal of Market Research reported on an experiment where three groups of respondents gave answers on either a 5-point, 7-point or 10-point scale. After this re-scaling procedure, the three scales gave almost identical results. The study reference is: Dawes, John "Do Data Characteristics Change according to the Number of Scale Points Used ? An experiment using 5-point, 7-point and 10-point scales". International Journal of Market Research.
Normative (Benchmark) Comparison: In addition to collecting more accurate information in a reliable format, the Likert 5-point scale is one of the most popular scales used for employee survey research. This popularity allows for valid cross-study/survey comparisons. In short, it allows us to compare the score of one company/division to that of another.
Login into the TalentMap Portal to view the tasks to complete during this survey period.
The portal is where you will have:
Clear visibility and guidance on every step of your project
Access to all resources
Real time data
Ability to view year over year survey projects
Reach out to your Project Manager if you need assistance with the tool or cannot find your login invite.
Start identifying and notifying the individuals who will be part of your survey team so they can begin preparing their deliverables.
Most clients keep their survey open for employees to complete for two weeks. This window allows enough time for the vast majority of employees to respond while providing a clear deadline which can be used to encourage responses.
If the survey period is too short, say one week, you may miss some people. If it open for too long, say four weeks, the process can get stale, it is difficult to motivate employees with a pending deadline, and you risk losing momentum for the 'analyze and act' phases for implementation.
TalentMap is focused on continuous improvement, so from time to time the TalentMap engagement survey dimensions and questions may change.
No, after the survey is completed and an employee clicks the “submit” button, there is no option to go back and change responses. Once responses are submitted, they are saved and locked.
TalentMap recommends including employees in an engagement or pulse survey if they have been with the organization for 3 months or more.
Once you have received your test link and feel it is ready, go to the Klient project management tool and update the status as well as message your PM that the survey sign off is complete.
We have developed a way to determine key drivers of engagement for not only large companies but also medium and small organizations, therefore reducing the need for the important questions. Asking your employees to describe the level of importance they feel toward each issue is more complicated than it appears. Measuring levels of importance can be done, but you need to take a statistical approach.
Rather than asking your employees to rate the importance of each issue, you should group related issues and solicit feedback regarding their overall satisfaction (or lack thereof). Then, you can use data analysis software to draw conclusions about levels of importance based upon high and low correlations between the individual issues and overall engagement.
Our software allows you to save your responses before you finish. You can always come back and complete your survey at a later time.
We keep our questionnaires short so that most surveys are completed in one sitting. This is a best practice that we encourage. However, when surveys are deployed using unique URLs, responses are saved each time that the respondent clicks the button at the bottom of each page before he/she moves on to the next page. As a result, the respondent can return to a partially completed survey (by clicking on their survey URL) at a later time to pick up where they left off and complete the survey.
We would not recommend this in order to be able to compare your results to our benchmark results. Our benchmark has proven to be reliable on the current scale so in order to ensure maximum comparability we recommend using the same scale as our standard questionnaire.
It is recommended that demographic questions be placed at the end of a survey.
Having demographic questions at the very beginning of a survey can deter participants from taking the survey and this could lead to lower response rates. If demographics are placed at the end of a survey, participants are still able to complete the survey and TalentMap is able to capture their survey responses.
It depends on the type of employees, some contract or term are an essential part of the organization, so YES if essential, these employees should be surveyed. However, there are other types of contract or term (like from IBM or Cisco for example or any other long term contract relationship) that associate with their firm and know the firm they are contracted with - so in that case NO.
Regarding employment length - anyone one that has been with the organization for 3 months or more would make sense.
Yes, please let your project manager know the day before the last reminder goes out.
The term “we” is meant to reflect the respondents’ general frame of reference. Depending on the size of the organization, the work environment and how respondents’ affiliate themselves with the organization, this may differ by organization or by person.
No, we use the same template for our Engagement and Pulse surveys.
Email Subject : Resignation - Please complete
As a follow-up to your formal letter of resignation, we would appreciate your feedback on your job experience at . I am sending you a link to a confidential on-line exit survey which should take no more than 20-30 minutes to complete. Your feedback will be valuable to us in our continuous effort to improve our employees’ experience, programs and work environment.
The survey is administered by a third party, TalentMap and is completely anonymous. At no time during or after the survey will individual responses be divulged to anyone at , unless specifically agreed to by you.
TalentMap will only share aggregate results (combined responses) and reports on the topics covered in the survey. To go to the survey site, simply click on the link below and follow the instructions at the TalentMap website.
[%URL%]
It is also important that you return all equipment to your manager by your last day. This includes all computer equipment, laptops, VPN, Blackberry, pass cards, and any other materials that you may have.
Please complete this survey at your convenience before your last day. We thank you in advance for your participation and feedback. We wish you well in your future endeavors.
Sincerely,
We prefer to wait until the next survey reminder so that all respondents remain on the same reminder schedule.
TalentMap recommends that organizations focus on employee engagement, rather than satisfaction, as a method of measuring performance and employee attitudes. Specifically,
Engagement is a more complete measurement tool than job satisfaction
Engagement studies reveal factors other than satisfaction that improve employee performance
Engagement studies reveal factors other than satisfaction that improve business results.
In addition to job satisfaction, engagement measures the extent to which employees commit to the organization, their level of discretionary effort, and how long they intend to stay with the organization as a result of this commitment . Unlike satisfaction surveys, engagement surveys identify the root cause of employee attitudes and behaviours, facilitating actions that improve business results.
Yes, we offer a high degree of customization for our standard questionnaire. Here are the key points about customizing the survey:
Full Flexibility: We provide a lot of flexibility when it comes to customization. There are no strict limitations tied to the percentage you can customize.
Easy Editing: You can easily customize questions by pulling them from our question vault. Once added to your survey, you can further edit them, add terminology, etc. The process is simple, similar to editing a Google doc.
Expert Guidance
An online strategic assesment is given by one of TalentMap's highly experienced consultants to clients with the objectives of:
Gaining a thorough understanding of the business context which led to the decision to conduct an employee survey
Bringing the Executive Team up to speed with exactly what is about to take place during the upcoming employee engagement survey. The session will cover the following topics:
Facilitated discussion - Business context leading to the decision to conduct an employee engagement survey:
Email Subject: “<INSERT COMPANY NAME> Entry Survey In order to drive continuous improvement with <company>’s hiring and onboarding programs, we would like to get your input on your experience joining <company>. To do this, we are inviting you to complete this Entry survey. This survey consists of <two> parts. This first part will ask you questions about your experience joining the company and the orientation/induction and training – for example, what training have you received and how helpful was it? The first part of the survey should take about 20 minutes to complete. The second part will be emailed to you after you have been with <organization> for <x> months. Each survey is geared to getting your input on various programs during your onboarding and will take approximately the same amount of time to complete as the first one. Survey background TalentMap was selected to deploy this survey for the very reason that they are a third party conducting the survey. The survey is your opportunity to tell TalentMap in confidence what you think about your onboarding experience at <company>. Please be assured that the survey is completely anonymous. All of the survey data is collected outside of <company> via a secure internet connection (SSL) and goes directly to TalentMap's secure servers. What will happen with my responses? TalentMap will directly receive and compile the data and report back to <company> on only aggregate results. TalentMap will not drill down on any responses within the demographics profile unless there are at least 6 responses in that group. Aggregated reports, from data provided by you and others who have joined the company, are used to improve hiring and onboarding programs and the work environment at <organization>. Privacy, Confidentiality and Anonymity TalentMap's contract with <company> stipulates that TalentMap will not reveal individual results or identities. At no time during or after the survey will individual responses be divulged to anyone at <organization> or any other third party. To find out more about the confidentiality of your responses, Please view TalentMap's privacy statement at or email . Also TalentMap, as a survey research organization, is a member of the Insights Association. As a member, TalentMap is bound by a code of ethics to protect survey research respondent privacy and personal information. Find out more about the Insights association code of standard at Take me to the survey The survey questions are easy to answer, and the whole process should take no more than 20 minutes of your time. To go to the survey site, simply click on your unique hot link below and follow the instructions at the TalentMap website. This link is your UNIQUE LINK and should only be accessed by you. For your own confidentiality and anonymity, please do not forward this link to others. <UNIQUE LINK> After you complete and submit your survey you will not be able to re-use this link. Please complete this survey at your earliest convenience. We thank you in advance for your participation and feedback. If you have any technical questions, you can contact TalentMap by replying to this email. If you have specific questions about the survey, please contact your HR Business Partner.
When creating or making changes to your Participant Information File, it is important NOT to upload columns that provide identifiable information as the data will not work for reporting due to TalentMap's confidentiality threshold.
If your file has fields such as Birth Date (Age) or Hire Date you can adjust the data to a range in Excel by following these steps:
Create three extra columns
Inset today's date into the second column
Whitelisting is a crucial procedure performed by your organization's IT systems administrator to ensure that TalentMap's IP addresses, email addresses, and domain names are not rejected or marked as junk mail. This step is necessary to successfully launch a survey via an email campaign, allowing participants to receive and access the survey information and link. Step 1: Whitelisting IP, Domain, and Email Addresses To ensure smooth delivery of survey emails, please whitelist the following IP, domain, and email addresses: SMTP (port 25): IP Address: 54.240.37.1 Port: 25 HTTPS (port 443): Domain: talentmap.com Email Address: Step 2: Ensuring Email Communication Across Multiple Locations If your organization has multiple locations with independent settings, it's important to ensure that all locations receive our email communications and allow survey recipients to access the server via the hotlink. If necessary, we can deploy a test survey to multiple locations to verify the setup. Step 3: Testing Mass Email Functionality Prior to the survey launch, an invitation email will be sent to all employees at once. If your organization has any restrictions against mass emailing, please test this function to ensure that all emails are successfully delivered. Step 4: Additional Test Survey Links If you would like us to send a test survey link to additional email addresses, please provide us with a list of those email addresses. We will include them in the test survey. By following these instructions, you'll be able to whitelist TalentMap's IP addresses, domain, and email addresses, ensuring successful delivery of survey emails to your participants. If you have any further questions or need assistance, please don't hesitate to reach out to us.
This comprehensive guide will teach you how to achieve high participation rates and increase engagement with thoughtful communication.
A brief overview to understand a snapshot report. Video length: 1m53s
When distributing reports or for data analysis, comparing a subset of your data is a helpful comparison measurement. To use comparisons in Snapshot Reports please follow these steps:
Click Reports then Snapshot. Choose your survey from the dropdown list in the top left of the page.
Click the Filters button then select a demographic filter. If you want to compare against the overall response count, then a filter is not necessary.
The average turn around is 5 business days. If you require it to be done faster, please message your Project Manager or email .
This communication package includes the following email templates:
Pre-survey email from CEO to managers
Pre-survey email from CEO to staff
Pre-survey email from HR
TalentMap is committed to improving organizations by helping their leaders collect, interpret, and leverage employee feedback. This is what we mean by “leading through listening.” Our clients’ survey programs contribute value to their organizations only when leaders use the results to take meaningful action. We continuously hear that what happens after the survey – interpreting, clarifying, prioritizing, planning, and acting – is where executives and survey program leaders need the most help. Yet, that’s where the ROI is.
The best way to remedy what happens AFTER the survey is to involve your Senior-Most Leader (i.e., CEO, CAO, Owner) and their direct reports BEFORE the survey is even designed.
At TalentMap, we call this an Executive Driven Survey. Having your executive team drive the survey includes the following preparation:
Please email your link to . If there is a wide spread issue throughout the organization, please contact your Project Manager.
Subject Line: <company> Employee Survey! Dear <company> employees, As part of an ongoing effort to create an engaging workplace for you, we are pleased to announce the launch of our online employee engagement survey. The survey is delivered by TalentMap, a company that specializes in employee engagement measurement and benchmarking. Please take some time, at your earliest convenience, to give us your feedback. Although encouraged, you are not required to complete the survey in one sitting. Each time you click “Next”, the survey will be saved. SURVEY INSTRUCTIONS To go to the survey site, simply click on the link below and follow the instructions. If during the course of completing your survey you decide to close it, please click “Next” and close your browser. When you are ready to continue return to this link enter, your PIN and click on it to continue the survey. Simply click on the following link to fill out the survey: url (input your confidential PIN number to gain access to the questionnaire) YOUR PIN is: ------------ The survey questions are easy to answer, and the whole process should take no more than 15-20 minutes of your time. We would like to assure you that at no time, during or after the survey, will TalentMap divulge individual responses. Survey responses are transmitted directly to a secure server at TalentMap and only aggregate results (combined responses) and reports on the topics covered in the survey will be provided. We thank you and look forward to hearing from you. The TalentMap Team For questions about the survey or technical support call 1-888-641-1113 ext. 508 or email
Sorting data within snapshot reports allows you to rank dimensions and items highest to lowest and vice versa for favourable scores and when comparing to overall, previous period, benchmark etc. To sort snapshot data please follow these steps:
Go to Reports > Snapshot, then select a survey in the top left.
Click on any of the column headers to sort ascending or descending. Click on Dimensions & Items header to sort back to the survey order.
This document package contains correspondence templates that TalentMap uses when deploying your organization's Employee Engagement Survey. These document templates are a starting point and may be edited according to your preferences.
When distributing reports or for data analysis, comparing a subset of your data to your organization's overall score is a helpful comparison measurement. To set this comparison in Snapshot Reports please follow these steps:
Click Reports then Snapshot. Choose your survey from the dropdown list in the top left of the page.
Click the Filters button then select a demographic filter.
These documents are a great resource to send to employees as part of your survey communications. If there are privacy concerns within the organization you can also send our Security & Privacy document.
Get a copy of our survey poster to help promote you survey around the office(s).
At TalentMap, our definition is grounded in both academic work and years of our own primary research with employees and employers. We define employee engagement as: "The extent to which employees put forth discretionary effort as a result of a logical and emotional connection to the organization." We use the framework "Head - Heart - Hands" to encapsulate engagement.
Mapping Tool: We have a mapping tool that allows us to map custom questions to benchmark questions. This helps in comparing data across surveys, even with customizations.
Strategic Approach: When customizing, we encourage thinking about actionability. We typically ask clients to consider what actions they would take for high or low scores on each question. This ensures the survey provides valuable, actionable insights.
It's important to note that while we offer extensive customization options, we always aim to balance this with maintaining the survey's validity and benchmarking capabilities. Our team is here to guide you through this process to create a survey that meets your specific needs while providing reliable, actionable data.
Industry trends and pressures
Change management in the organization
Turnover and morale
What are the expectations for the engagement survey?
What specific issues need to be addressed?
Presentation
Employee engagement: what's real and what's myth?
Benefits of Employee Engagement
How do we measure employee engagement? (The questionnaire)
The TalentMap Seven Step Survey Process, and managers' roles at key points during the process
Survey Deployment
Best practices for maximizing response rates
Examples of reporting
FAQs
Book some time with your consultant using the link provided by your Project Manager to prepare for this session, as well as for the actual session itself.
Benchmark comparisons are extremely valuable in providing some external perspective for an organization’s engagement survey results. This is particularly true for a first-time survey. Scores across the array of topics measured by a comprehensive employee engagement survey can vary widely. So, it is important to know what a “typical” score is for specific topics.
TalentMap maintains a wide variety of external benchmarks to provide clients with options to compare themselves against other organizations based on organization size (i.e., small, medium and large), sector (e.g., public, private, non-profit, etc.) and industry (e.g., financial services, healthcare, utilities, etc.). Selecting the most appropriate benchmark is very important but may not be as simple and straightforward as it might appear at first glance. Most organizations instinctually believe they should compare themselves against a benchmark of other organizations that are exactly like themselves. And there certainly are specific industries where that makes perfect sense because of the specialized nature and employee demographics of these organizations. A hospital, for example, is a highly unique environment that is populated largely by people with professional training and credentials specific to that industry – i.e., doctors and nurses. Comparing a hospital with a composite benchmark of other hospitals makes the most sense. Similarly, a financial services organization typically would choose to compare itself to others in the financial services sector, particularly given that these organizations are largely populated by white-collar employees.
But a precise same-industry benchmark comparison is not always the most appropriate choice. For example, an organization that has a highly specialized product or service offering but is comprised of job roles and people who could be recruited from or be lost to any number of other organizations or industries might select a more varied and robust benchmark comprised of similar-sized organizations across a wide variety of industries. As another example, some public sector organizations prefer to be compared to a broad benchmark that includes both public and private sector employees.
Regardless of the specific benchmark selection, it is important not to get overly obsessive about benchmarks. They simply provide a general reality check on what is a typical score for one issue versus another. The most valuable information a survey provides is how different parts of the organization compare with each other, how different subgroups of employees view the organization, whether the organization is making substantive progress over time and the identification of the most impactful issues on employee engagement using key driver analyses.
TalentMap unveiled its enhanced Employee Engagement questionnaire in October 2022. Click on the link below to access the full survey. If you are making changes to the survey, please use track changes to highlight your modifications.
The following are the key highlights of the questionnaire design:
TalentMap’s enhanced employee engagement questionnaire better captures the most important organizational dynamics that impact and drive employee engagement, which now is measured in terms of how connected employees are to the organization as a whole, as well as how energized and inspired work teams are to go the extra mile.
A slightly revised five-item Organizational Engagement dimension now includes a question about overall satisfaction with the organization as a place to work and a question about the likelihood of accepting a position with another employer within the next 12 months to assess retention vulnerability. This dimension assesses how connected employees are to the organization as a whole – i.e., their pride in the organization, optimism about the future, likelihood of recommending the organization, likelihood of staying with the organization and overall satisfaction with the organization as a place to work.
This new dimension represents an important enhancement to how we examine engagement. In addition to Organizational Engagement, which measures how connected employees are to the organization as a whole, Team Engagement measures the immediate team dynamic – i.e., the overall energy level of the team and the extent to which the team is inspired to go above and beyond the call of duty. This dimension includes questions about the team continuously striving to improve performance, producing outstanding quality work, taking ownership of problems or issues until resolved, going to great lengths to please internal/external customers, etc.
A new dimension that clearly focuses on role clarity, sense of accomplishment, skills and abilities utilization and enjoyment of the work itself.
A new dimension that assesses the extent to which employees have the systems and resources (training, materials, equipment, information, etc.) they need to do their jobs well. This dimension often correlates highly with Team Engagement.
A new question has been added to this section to determine whether employees feel the organization is doing a good job of developing leaders.
A new internal equity question has been added to this dimension to assess the extent to which employees feel they are being paid fairly compared to what they know about other employees in similar roles within the organization.
This dimension has been expanded to make it broader in scope than simply focusing on the formal performance appraisal. It now includes questions about employee accountability and whether the immediate manager is providing constructive feedback, coaching, and guiding, recognizing good performance, etc.
This new dimension includes items that capture several aspects of an organization’s culture that are more intangible than other dimensions in the survey but are very critical and correlate highly with engagement. It includes questions about the organization treating employees with respect and dignity, caring about its people, creating an environment where it’s safe to speak up, operating with integrity, etc.
Given the critical role that the immediate manager plays in inspiring employees and work teams, this dimension has been enhanced to include several new questions about the immediate manager helping employees understand how their work contributes to organizational success, inspiring the team, acting on employee suggestions and being an effective leader.
Similar to the critical importance of inspiring leadership by the immediate manager, the Senior Leadership dimension has been enhanced to include several new questions about the extent to which the senior leadership team is doing an effective job of establishing priorities, being visible, inspiring employees and leading the organization. A new question also has been included to gauge whether employees believe senior leaders will act on the survey results.
A completely revised and enhanced optional Diversity and Inclusion dimension now captures respectfulness and inclusion dynamics for team members, work colleagues, the immediate manager, and senior leaders.
A high response rate is crucial for the success of any survey program. TalentMap, renowned for its employee surveys, has achieved an impressive average response rate of 80%. In this article, we will explore effective strategies to help you surpass this benchmark and maximize your survey participation.
Survey Launch
To kickstart your survey, organize an engaging event such as a coffee and donuts gathering. Use this opportunity to introduce the survey, generate enthusiasm, and inform employees that the survey link will be available in their inbox upon their return. Encourage them to take 20-25 minutes to complete it at their desks.
Management Team Promotion
Engage the management team by encouraging them to personally promote the survey. A brief walk around the office by managers, endorsing the importance of the survey, can be impactful. Additionally, empower department managers to motivate their teams, fostering a friendly interdepartmental competition that drives participation.
Company-wide Contest
To incentivize achieving a target response rate, hold a company contest. Announce that names will be entered into a draw only if the desired response rate, such as 80%, is reached. Prizes could include tickets to sports events, restaurant certificates, a pizza lunch, a bottle of wine, or even an iPad.
Department Contest
To further promote participation, hold a contest among departments. Offer a reward, like a pizza lunch, to the department with the highest response rate by the end of the first week. This creates friendly competition within the organization and encourages employees to rally their teams.
Survey Champion
Designate a survey champion who will actively promote the survey by conducting a walk-around, engaging employees, and asking if they have completed the survey. This personal touch can motivate employees to participate and emphasize the significance of their input.
Survey Wind Down
Once the survey concludes, organize a wind-down event with coffee and donuts, expressing gratitude to all participants. This gesture reinforces the importance of their contributions and leaves a positive impression of the survey process.
Allow Time for Survey Completion
To facilitate maximum participation, offer employees the opportunity to wrap up their working day 30 minutes ahead of schedule, giving them ample time to complete the survey without feeling rushed. This shows respect for their time and emphasizes the survey's significance.
Charity Donation
Inform employees that, for every survey response received, the company will make a donation (e.g., $2-$5) to a chosen charitable organization. This approach highlights the broader impact of their participation, making it a win-win situation for both employees and the community.
Achieving a high survey response rate is essential for a successful survey program. By implementing the strategies outlined above, including creating excitement, incentivizing participation, and acknowledging employee efforts, you can surpass the average response rate and gain valuable insights from your workforce.
We currently have physical copies that support English and French. However, we can provide digital artwork for clients to tailor to their specific needs.
We understand that not all employees have regular access to computers, especially in industries with field workers or non-desk jobs. We have several methods to ensure all employees can participate in the survey:
PIN Survey:
Each employee can access the same link using a PIN that identifies them. The PIN will also store any demographic data you wish to collect from the respondents so they do not need to self-identify.
Kiosk Setup:
You can set up dedicated kiosks or stations with laptops or tablets at your workplace.
Employees can use these to complete the survey during designated times.
Paper Surveys:
While less common now, we still offer paper surveys as an option.
However, we recommend this as a last resort due to potential issues with delayed returns and confidentiality.
Mobile/SMS Access:
We can send unique IDs or links via text message for employees to complete the survey on their smartphones.
Measuring engagement is one thing; understanding and using the results is another. You need a report that is robust but practical. TalentMap reports make it easy to interpret and use the survey findings. These reports give you actionable information about your team's engagement.
We offer a wide range of flexible reporting options including:
Snapshot with Key Driver Analysis
Dashboards
Executive & Manager Reports
Heatmaps
Correlations
Insights
Comments with;
AI meaning, Q&A and Topics and Suggestions
Sentiment Analysis
Word Clouds
All reports include year over year comparison data, benchmarking, comparison to a larger group or overall organization. Reports can be easily exported to Power Point, PDF and Excel. Our Batch reporting allows you to run hundreds of reports at the click of a button.
Measuring employee engagement is the equivalent of establishing the baseline health of your team. The results will reveal indicators of healthy and unhealthy conditions. You could also compare these findings, for example, with other teams or against the performance of the organization as a whole. These insights will help you understand how your team is doing relative to the organization and other teams.
With any attitudinal type of survey, there is typically a positive response bias to begin with. For this reason we place the negative response first because this will force the respondent to read through the entire scale and minimize the positive response bias.
You can make changes to your PIF once throughout your survey process. Please contact your Project Manager if you expect to make additional changes.
Here is an overview of the typical project timeline for an engagement survey:
Initial Phase (1-2 weeks):
Kickoff call
Survey design (1-4 weeks, can extend up to 6 weeks)
Pre-Survey Phase (2-3 weeks):
Pre-survey communication (1-6 weeks)
Survey Phase (2-3 weeks):
Data collection (typically 2 weeks, rarely more than 3 weeks)
Analysis and Reporting Phase (1-2 months):
Online reporting becomes available
In-depth analysis and connecting the dots
Presentation of results to leadership team (in stages)
Post-Survey Phase (6-8 months):
Ongoing access to online reporting
Overall timeline:
From signing to kickoff: As quick as a few days
From kickoff to survey launch:
For new clients: Recommended 6-8 week window
For experienced clients: Can be as tight as 4-5 weeks
It's important to note that the entire process typically spans about three months, broken down into these phases:
Month 1: Kickoff, survey design, email list preparation, communication planning
Month 2: Data collection (first 2-3 weeks), initial reporting (last week)
Month 3: Rolling out results to the rest of the organization
These timelines can be adjusted based on your organization's size and specific needs. We're flexible and can work with you to create a timeline that best suits your requirements.
We're very flexible when it comes to incorporating your organization's specific themes or categories into the survey. Here's how we can do that:
Customization: We can fully customize the questionnaire to include your organization's unique themes, values, or initiatives. This is a common request and we're well-equipped to handle it.
Leadership Values: If your leadership team has established a set of values or principles specific to your organization, we can incorporate these into the survey. We can ask questions about awareness, implementation by managers, and how well these values are being lived out in the organization.
Expert Guidance: Our team of organizational psychologists (I/O psychologists) can provide advice and guidance on the best way to design and phrase questions to effectively measure your specific themes.
Unlimited Support: If you decide to modify the questionnaire, we offer unlimited support from our expert psychologists This could involve one meeting, multiple meetings, or email exchanges - whatever is needed to get the survey exactly how you want it.
Flexible Approach: Whether you want to add a few custom items or develop entirely new themes, we can accommodate that within the survey structure.
Psychological Expertise: Our psychologists can help ensure that the questions are phrased in the most effective way to measure what you're truly trying to assess.
The goal is to create a survey that accurately reflects your organization's unique culture and priorities. We're here to help you achieve that in the most effective way possible.
We're more than happy to incorporate questions about your organization's mission, vision, and strategic plans into the survey. Here's how we can approach this:
Custom Questions: We can add specific questions that directly address your organization's mission, vision, and strategic plans.
Alignment Assessment: We can include questions that assess how well employees feel their work aligns with these broader organizational goals.
Communication Effectiveness: We can gauge how effectively these key elements are being communicated throughout the organization.
Open-Ended Feedback: We can include open-ended questions to gather more detailed insights:
Customization Process: Our team will work closely with you to understand your specific mission, vision, and strategic plans. We'll then craft questions that accurately reflect these elements and resonate with your employees.
Expert Input: Our organizational psychologists can provide guidance on the most effective way to phrase these questions to get meaningful, actionable data.
Incorporating these elements into your survey not only provides valuable insights but also reinforces their importance to your employees. It's a great way to keep everyone aligned with your organization's broader goals and direction.
There is no "right" length but we do recommend following these three ideals to ensure that an employee is engaged while filling out the survey:
Under 30 minutes.
7 radio button items per minute.
2 closed-ended questions per minute.
Now you will insert the following formula into Column 3 called Actual Age: =YEARFRAC(E2,F2,1) Where E2= Date of Birth F2 = Today’s Date 1 = the fraction argument. Read more about the options HERE
Now you can create the Age Range
Use the formula =LOOKUP(G2,{0,"20 and Under";20,"20 and Under";21,"21-25";26,"26-30";31,"31-35";36,"36-40";41,"41-50";51,"51-55";56,"56 and Over"}) Where G2 is equal to the actual age. Start with zero and move your way up. Make sure that this is the breakdown that you want. Spot check your age ranges to make sure that they make sense.
Note: The below formula will work for Length of Service:
=LOOKUP(L2,{0,"Under 1 year";1,"1-3 years";3,"3-5 years";5,"5-10 years";10,"10-20 years";20,"20+"})

Click Comparisons, then check Other. Select a survey from the dropdown. You can compare to the current survey or a previous period survey (if available). Next, click Filter and choose a comparison group. Lastly, add a comparison label.
If you have setup Previous Period and Benchmark data, you will see the demographic comparison data in the middle displayed as a % favourable score that is greater (+) or lower (-) than the comparison group % favourable score for that dimension or item.
Click Export to generate a PowerPoint deck or Excel file.

Ensuring the executives know they own the survey, not HR.
Aligning the survey content and report system (Compass) to the executives’ priorities, including the company strategy, change initiatives, external headwinds, and internal challenges.
Showcasing the executives in innovative communications via video recordings, internal messaging platforms, live meetings, and emails.
Planting seeds for executives to collaborate with employees across silos and levels as part of a transparent and iterative action planning process.
Illuminating for executives the idea that survey responses are not about making employees “happy” but rather they are about finding shared dissatisfaction with the status quo so that the organization is primed for tackling change.
At the most basic level, involving your executives in promoting the survey is likely to influence your participation rate for the survey. But there is so much more potential.
If you want HR to have a seat at the table, you need to make the survey more strategic and business focused. Connecting survey content to organizational performance metrics, strategic planning, and/or efficiency goals makes the survey more than “just an HR activity” about “making people happy.”
If you are trying to spur more sustained change effort from your leadership team after the survey reports go out, you need to get commitment from your executive team on achieving a new (or existing!) desired outcome that is related to employee feedback from the survey. Building ongoing dialogue with the executive team early in the survey process lets you prepare them for a commitment to demonstrate change in response to feedback.
If you want to foster a stronger relationship with the executive team, one where you are a trusted internal consultant for people strategy, then you need to work with the executive team more on high-profile HR activities. The employee survey is highly visible, and very important in showing what is important while creating upward feedback that leaders need to know about.
If you need to build trust between and among leaders and the workforce, then giving the executives the responsibility for communicating and reacting to survey results provides the opportunity for them to take that step forward.
Your executives need to take a preliminary Strategic Assessment that will be used for a Strategic Engagement session with them, where a TalentMap consultant will leverage the information to explain (a) how the engagement survey will connect with their interests, (b) how they can convey their ownership of the survey process to employees, (c) what the Executive Presentation of results will be like (after the survey), and best practice for what the executive team needs to do to create improvements from the survey results.
Take the preliminary Strategic Assessment online from TalentMap (10 minutes).
Participate in the Strategic Engagement session before the survey is launched (and preferably before the survey content must be finalized – 1 hour).
Commit to pre-survey communication messaging (1-2 hours total).
Commit to communicating and reacting to survey results in a medium accessible to all employees (2 hours).
Commit to a transparent, collaborative, and iterative action stage related to just one organization-wide issue raised by the survey feedback (and related to business performance).
Commit to ongoing updates for employees on progress.
24-48 hours after the live survey has closed, your organization will receive a scouting report which includes areas of alignment or discrepancy between leadership and employees based on employee comment feedback. See Scouting Report for more information.
To view and sort only by items (questions) within the survey, click Comparisons, then check Show Questionnaire Items Only. This will hide the dimension titles and scores. Click on the column headers to sort.

Click Comparisons, check Organization Overall and OK.
If you have setup Previous Period and Benchmark data, you will see the Organization Overall comparison data in the middle displayed as a % favourable score that is greater (+) or lower (-) than the comparison group % favourable score for that dimension or item.
Click Export to generate a PowerPoint deck or Excel file.

We believe in a collaborative approach with clear responsibilities. Here's a breakdown of who typically handles different aspects of the project:
TalentMap Team:
Senior Project Manager:
The primary point of contact for any questions or concerns
Oversees the day-to-day logistics
Works closely with your team
Manages timelines, milestones, and project schedules
Handles email communications and coordination
Manages some back-end tasks such as programming and sending out the survey
Organizational Psychologist/Executive Consultant:
Assists with questionnaire design
Helps your leadership team understand survey results
Provides expert guidance throughout the process
Survey Team:
Handles technical aspects of survey deployment
Manages data collection and analysis
Developers and Analysts:
Work behind the scenes to ensure smooth technical operation
Your Organization's Team:
Executive Team:
Participates in kickoff call and alignment meetings
Supports and endorses the survey process
Shared Responsibilities:
Survey Design: Collaborative effort between our organizational psychologist and your team
Communication Strategy: We provide templates and guidance, but your team typically handles the actual communication
Action Planning: We provide tools and guidance, but your team leads the implementation
Here's a typical timeline:
Month 1: Kickoff, survey design, logistics planning
Month 2: Pre-survey communication, survey deployment (usually 2 weeks in the field)
Month 3: Data analysis, results interpretation, action planning
We're flexible and can adjust roles and responsibilities based on your organization's needs and preferences. Our goal is to guide you through the entire process, leveraging our expertise while respecting your knowledge of your own organization.
We provide comprehensive support throughout each phase of the survey process. Here's a breakdown of the support you can expect during each stage:
Pre-Survey Phase:
Executive team alignment and kickoff call
Guidance on survey positioning and communication
Questionnaire design support
Logistics planning (e.g., dealing with different locations, firewalls, emails)
Survey Design:
Expert advice on question types and survey length
Customization options (e.g., different questionnaires for different staff groups if needed)
Best practices for question design to maximize impact
Survey Deployment:
Pre-survey communication support
Technical support for survey distribution
Monitoring of response rates
Data Analysis:
Quick turnaround (usually 1-3 days) for initial data analysis
Access to online reporting tools for real-time data viewing
In-depth analysis comparing your results to benchmarks and other companies
Results Presentation:
Two-stage presentation process: a. Preview presentation for HR/survey team b. Detailed presentation for leadership team
Discussion and validation of assumptions
Opportunity for deeper data exploration
Post-Survey Support:
Training or workshops for managers and HR teams
Post-survey consulting or coaching
Self-guided learning resources on how to use and interpret the data
Ongoing Support:
Guidance on follow-up actions and next steps
Availability for questions and additional analysis as needed
Throughout the entire process, you'll have access to our team of project managers, developers, and analysts. Our senior project manager handles day-to-day logistics, while our executive consultant is involved in questionnaire design and helping the leadership team understand the results.
We're committed to guiding you through every step, leveraging 20+ years of experience to ensure a successful survey process and meaningful outcomes for your organization.
To monitor, filter and export live survey response rates or view historical rates, please follow these steps.
Login to Compass, click Reports then Response Rate.
Select a survey in the dropdown near the top left of the screen.
On the left side of the screen, you will see the option to display responses based on demographic information.
You can add multiple layers by clicking the + icon to breakdown demographic data.
To view the breakdown of multiple demographics, click the dropdown next to a demographic field or click the open / collapse orange icons below overall response rate.
Filter response rates to generate reports for specific demographic groups by clicking Filters in the top right. Available data will be displayed in the center column where you can choose demographics. Once a field is selected, you will see the available filter options in the right column. Check box(s), then click OK. Note: you can select multiple filters by clicking the + button again, then select AND / OR.
Export to Excel by clicking export in the top right corner. Add a title to the file, then click Export. Note: the export file is timestamped using UTC time. For more information on UTC timezone conversion, please view this .
If your organization has AI enabled, you will see "Include AI Overview Slide" for both single and bulk snapshot exports. Once checked, this will add a PowerPoint slide near the beginning of the report.
Engagement Overview
Engagement Score with comparison data selected
Recommend as great place to work survey item
Optimistic about the future survey item
Intend to stay survey item
Strongest Drivers of Engagement (30 responses or more)
The three strongest drivers of engagement
Doing Well
Up to three survey items that most strongly correlate to engagement and have POSITIVE comparative or favourable scores.
Look to Improve
Up to three survey items that most strongly correlate to engagement and have NEGATIVE comparative or favourable scores.
A heatmap report allows you to quickly compare demographic groups scores to the organization overall or to a filtered group.
To add a heatmap slide(s) to your snapshot report export, follow these steps.
Click on Reports > Snapshot. Choose the survey you wish to run reports for, then click Export. Note: You may apply filters to generate heatmap slides for a specific sub-group (ex. you wish to see departments within a Division).
Select a demographic from the left dropdown. The right dropdown allows you to choose to compare to the organization overall, the filtered group or to previous period. Note: if no filter or previous period is applied, then those options cannot be selected.
Click the + button again to add multiple heatmap slides by demographic. These slides will be exported in the order they are created.
Delete individual selections by clicking the garbage can, or click Clear All in the top right of the window to clear all selections.
Note: Depending on how many columns appear in the slide, the heatmap table may run off the slide. You can click on the image of the heatmap in PowerPoint and drag the corners to adjust the size. Note: The export window will save your selections so that you can apply new filters and quickly run reports with the same heatmap demoraphic groups. These slides are placed below the Overall Dimension Scores slide(s) in the order they are created.
Filtering data within reports allows you to drill down and explore specific cuts of data. You can filter data in four ways:
Demographic: Data that is created from the column headers in a Participant Information File sent via an email campaign.
Survey Items: Questions that are asked within the survey.
Date: Filter responses based on a Start and End date. This option is typically used for surveys that run over an extended period of time such as onboarding or exit surveys.
Click Reports, then Snapshot. Filters will work the same across all report types.
Select a survey from the survey dropdown in the top left.
Click Filters in the top right corner. Available data will be displayed in the center column where you can choose between Demographic, Survey Item and Date. Once a field is selected, you will see the available filter options in the right column. Check the boxes for data you would like to filter, then click OK. Note: you can select multiple filters by clicking the Plus button.
Once applied, filters will be displayed and the total responses will update to reflect the filtered results.
Click the X on a filter tag to remove the filter and refresh the results.
TalentMap performs several checks when you add contacts to Email Campaigns, to help ensure that you send your emails to clean lists.
TalentMap performs the below checks when you add email addresses to Email Campaigns or Contact Lists.
This practice ultimately mitigates against a high bounce rate for your campaign and ensures as many messages as possible reach their intended recipients (not to mention, it reduces the likelihood of recipients marking email as spam).
TalentMap will check your contact lists to make sure that your contacts meet the below requirements. Contacts that fail to meet these requirements will be prevented from being added to your campaign or list.
Contact is a valid email address TalentMap will make sure that an email address that you are adding/uploading to your campaign or contact list is in-fact, a valid email address.
[email protected] is a valid email address, whereas Jane.Smith@, @yourcompany, or Jane are not.
Email address is not a group email TalentMap will not send email to any addresses uploaded to Email Campaigns that are considered group emails such as [email protected] or [email protected].
If you are uncertain as to wether an email is valid or not. There are simple online tools such as to check for validation.
Exporting lookup / lookdown slides in snapshot reports allow you to compare groups above and below a certain demographic for a dimension or item (ex. Organizational Engagement).
This report type is great for comparing a specific question or dimension for a leader or manager where they have hierarchical or geographic groups that rollup or rolldown. Here is an example of what the slide looks like:
Click on Reports > Snapshot. Choose the survey you wish to run reports for, then click Export. Note: You may apply filters to generate lookdown slides for a specific sub-group (ex. you wish to see Engagement scores for departments within a division).
Use the dropdown lists to select both a Demographic and Survey Dimension or Item. Note: Click the dimension text to add the overall dimension scores or select an individual item. When adding an item, click the arrow next to the dimension text to show the items within that dimension.
Click the + button again to add multiple lookdown slides. These slides will be exported in the order that you create them on the webpage.
Delete individual selections by clicking the garbage can, or click Clear All in the top right of the window to clear all selections.
Note: The export window will save your selections so that you can apply new filters and quickly run reports with the same lookdowns. These slides are placed above the Overall Dimension Scores slide(s) in the order they are created.
Go to Filters and select the demographic group you wish to isolate.
Once the filter is applied, click Export. You will now see the option to add a lookup demographic filter.
If you have more than one lookup group, apply them in the hierarchical order that they were created in the participant file.
Live survey response rates are updated once an hour. This includes the overall response rate and any demographic response rates that you may have included from your Participant Information File.
TalentMap makes it easy to collect and understand your employee survey data so that you can take action and drive productivity. After the survey closes, you will be able to access reports via Compass, TalentMap's online reporting tool.
If you have received an email to login to Compass and are ready to view your reports, we recommend first viewing the Snapshot Report. This report provides a high-level overview of the surveys scores.
The General tab within this knowledge base, will explain how to run filters and bulk exports. If you are interested in comparison data, then Heatmap is a great place to start.
All reports within Compass have built in confidentiality. No group can be accessed without 5 responses or more.
When creating a snapshot report for specific demographic groups you may not have or may not need to show previous period and/or benchmark data. To hide this data on the webpage and exports, please follow these steps.
Go to Reports > Snapshot, then click Comparisons.
Uncheck the checkbox(s) next to Benchmark and / or Previous Period.
Click OK.
The columns of data will be hidden on the snapshot webpage and on the export.
The participant information file (PIF) is an excel file that provides TalentMap with all your participant-information needed to deploy your survey and group/analyze the data collected. We often survey with the hope of understanding where things are going well, as well as where to improve. Demographics allow you to unpack your overall results and examine meaningful differences between groups of employees.
Demographics that identify groups that score favourably can help uncover best practices that can be implemented in other areas, on top of uncovering opportunity areas that require immediate attention.
Exporting survey response rate slides allow you to show aggregated response counts across demographic groups (i.e Division, Department etc.)
To add a response rate slide(s) to your snapshot export, please follow these steps.
Click Reports > Snapshot. Select a Survey, then click Export. Note: You may apply filters to generate response rate slides for a specific sub-group (ex. you wish to see departments within a Division).
Click the + button, then use the response rate dropdown to select a Demographic.
Here are the important details about the access to our online reporting tool, Compass:
Two admin licenses: You'll have two main licenses for the online reporting tool. These are typically admin-level licenses with full access to both reports and the admin pages.
Additional restricted users: Beyond the two main licenses, you have the flexibility to add more users with full or restricted reporting access.
Customizable privileges: For additional users, you can customize their access levels. For example:
Yes! TalentMap, is an expert in employee surveys. All responses are collected confidentially. TalentMap will not share individual responses at any time with anyone within the organization. Only aggregate (combined) responses will be provided. This is done within the guidelines of , the North American Organization that sets the Code of Standards and Ethics for Survey Research. TalentMap is also , which sets the standard for global information and data security management.
View TalentMap's
Bulk exports allows you to produce reports effortlessly by running multiple reports at a time using the surveys demographic data. Bulk exports are currently supported on the following report pages:
Dashboard - PowerPoint
Snapshot - PowerPoint
Heatmap - Excel
The Employee Net Promoter Score (eNPS) question is typically:
"On a scale of 0 to 10, how likely are you to recommend [Organization Name] as a place to work?"
This question is the core of the eNPS survey and is designed to measure employee loyalty and satisfaction. The scale used is as follows:
0-6: Detractors
7-8: Passives
Typically involved in early stages (executive briefing & survey design) and later for results interpretation
HR Team / Project Lead:
Acts as the main point of contact for TalentMap
Coordinates internal logistics (e.g., providing participant information file)
Assists with internal communications
IT Department:
May need to be involved for firewall or email delivery issues
Managers and Team Leaders:
Help communicate about the survey to their teams
May be involved in action planning post-survey
Typically, the survey is in the field for about 2-3 weeks
Export Response Rate
Export Lookdown
Export Heatmap
Export Key Driver Analysis


Here are the key points about scheduling the questionnaire design call:
Timing: It's recommended to schedule the call at least 1-2 weeks prior to the survey launch. This allows time for potential follow-up calls and revisions. You have the flexibility to book sooner if you prefer.
Booking process:
You can book the call directly using your consultants' calendar link provided in the task details.
Look for a "60-minute survey design call" option when booking.
Purpose: This initial call is to go through the full questionnaire with your consultant. The consultant will help you craft new questions or edit existing ones as needed.
Preparation: Before the call, you'll receive:
A draft of the new standard questionnaire (which has some new sections since 2021)
A copy of your previous survey for comparison
Remember, it's better to schedule this sooner rather than later, especially if you anticipate needing follow-up discussions or team reviews after the initial design meeting.
The use of AI requires organization approval. Please let your TalentMap Project Manager know if you would like this feature enabled. Only users with permission to see comments will have access to AI summary and suggestions.
Demographics help you narrow in on local differences - such as region, department, or team manager - helping to ensure consistency across the business.
Confidentiality: Is represented by the reporting threshold. The higher the threshold the more confident respondents can be that their responses will not be linked back to themselves as individuals. The threshold can be set as low as 5 respondents or as high as you wish – the higher the better. While creating the PIF, use this threshold to guide your demographic grouping decisions.
Each row represents one participant and must have an email address (work or home). Work emails are best – include whenever possible. Each column represents a demographic category we will use to filter the data. There are no limits to the number of columns you can include. However only include data you will use or need. All reports will use the language provided here, so ensure:
That none are longer then 35 characters. If so, shorten them to ensure they will not be cut off in reports.
The case is consistent (sentence case looks best in reports)
There are no acronyms
Everything is spelt correctly
Don’t include the following demographic data:
SIN number
Birth date
Hire date
Record id, employee id
First and last name of employees
Any demographic unique to the individual
Demographics that have less than 5 respondents – demographics with less than 5 should be merged with another group, left blank or merged into an ‘Other’ category.
If you can’t report on it or don’t need to, leave it out. Include less specific data like: age ranges (i.e., Under 25, 25-34 years, 35-44 years, 45-54 years, 55+ years) and, length of service ranges (i.e., Under 1 year, 1-4 years, 5-9 years, 10-19 years, 20+ years). When adding your organizations hierarchy as demographics, consider how your organization is structured. This will allow for best roll-up reporting for managers and executives.
Create a pivot table and analyze your groupings. Keep your groupings (number of participants in each demographic option) above your minimum reporting threshold. Ensure there are NO:
Duplicate or missing emails,
Formulas,
Filters, or hidden columns,
Individually identifying information,
Acronyms
Ensure that your highest-level reporting is represented in a column.
Your PM will also run quality control checks on the file and will reach back to you to discuss. Your PM may also schedule a meeting with you to review PIF issues or changes that are needed. Once the checks are done and changes are made, you will provide the FINAL version of the PIF to your PM.
Click the + button again to add multiple response rate slides by demographics. These slides will be exported in the order they are created on the webpage.
Delete individual selections by clicking the garbage can, or click Clear All in the top right of the window to clear all selections.
Note: The export window will save your selections so that you can apply new filters and quickly run reports with the same response rate demographic groups. These slides are placed below the cover slide in the order they are created.

Viewing comments
Seeing all data
Accessing specific reports
Manager access: If desired, you can provide access to managers or HR business partners. Some of our clients have over 100 managers using the tool.
Training: We'll provide training on how to use the tool after the survey closes.
Ongoing updates: It's worth noting that the tool is frequently updated, roughly every 2-4 weeks, with new features.
Here's an overview of user permissions
The decision to grant access beyond your core team is entirely up to you. If you do decide to give broader access, you'll be responsible for supporting those users, but the manager (restricted) view is very user-friendly and doesn't typically generate many support requests.
Correlations - Excel
To run reports in bulk, click Export, then the bulk export option.
For snapshot export, you can add additional slides such as response rate, lookdown, heatmap and key drivers. For all other reports, just select a demographic value and click OK.
Click the Downloads page in the main header to view download activity and add the report folder to your computer. CClick on the blue title to download the bulk report.
When a bulk export is complete, you will also receive an email from TalentMap with a link that will open a tab to the Downloads page in Compass.
After collecting responses, the eNPS is calculated by subtracting the percentage of Detractors from the percentage of Promoters. The result can range from -100 to +100.
eNPS results are visible on both the Snapshot and Dashboard report pages and can be exported as a single item or within a lookup / lookdown slide.


Effective communication about the survey is essential for high participation rates and meaningful results. We have a comprehensive approach to help you communicate the survey effectively to your employees:
Pre-survey Communication Plan:
We'll help you develop a communication strategy that starts well before the survey launch.
This typically includes emails, posters, and announcements from leadership.
Executive Involvement:
We strongly recommend that the survey be executive-led. When employees see that top leadership is invested, they're more likely to take it seriously.
We have draft message templates from your CEO or other executives to emphasize the importance of the survey.
Clear Messaging:
We'll help you craft clear messages that explain:
The purpose of the survey
How the results will be used
Multiple Channels:
We recommend using various communication channels to reach all employees, such as:
Intranet announcements
Manager Briefings:
We can help you prepare managers to discuss the survey with their teams, as they play a crucial role in encouraging participation.
FAQ Document:
We have a that addresses common questions and concerns employees might have.
Reminder Strategy:
We'll assist in developing a reminder strategy to boost participation rates throughout the survey period.
Emphasize Confidentiality:
We'll help you clearly communicate how employee confidentiality is protected, which is vital for honest feedback.
Highlight Action Plans:
If you've conducted surveys before, communicate actions taken based on previous feedback to show employees their input leads to real change.
Customized Materials:
We can provide templates for posters, email communications, and other materials that you can customize with your branding.
Multi-lingual Support:
If needed, we can help with translations to ensure all employees understand the survey's importance.
The key is to make employees feel that their input is valued and will lead to meaningful changes in the organization. We're here to support you throughout this process and can tailor our approach to your specific organizational culture and communication style.
Whitelisting ensures any email or website access from/to talentmap.com is not blocked by your company's firewall or goes to your employees junk mail.
Please whitelist the following IP, domain and email addresses:
SMTP(port 25): 54.240.37.1:25
HTTPS(port 443): talentmap.com
Please follow the steps below to ensure whitelist success:
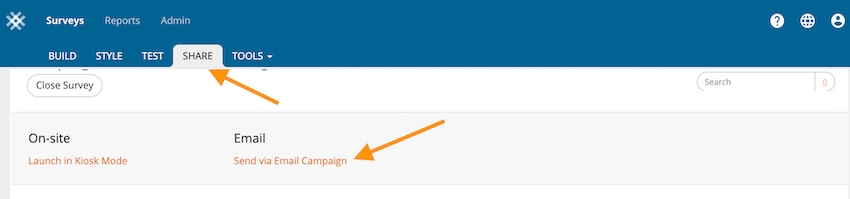
Once you have created your first survey and are ready to deploy to staff, click the Share tab, then scroll down to Send Via Email Campaign.
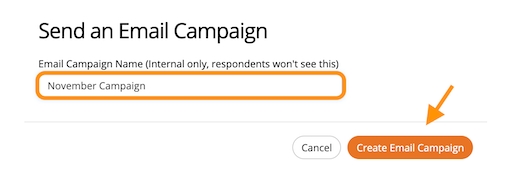
Type in a name for the campaign, then click Create Email Campaign.
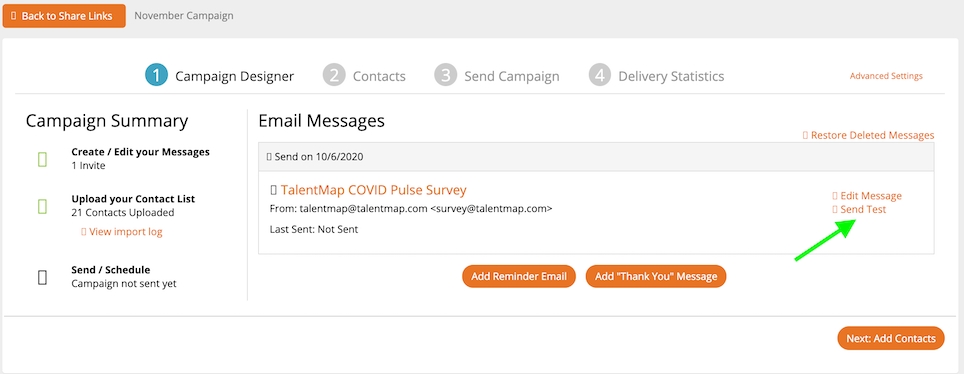
This will bring you to the Email Campaign Designer. Click Send Test.
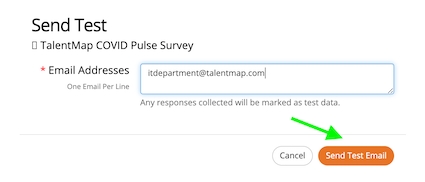
Enter the email of your IT contact responsible for managing email domains. Click Send Test Email.
Previous period comparison in the heatmap page allows you to view changes to scores within demographic groups from one survey to another. These reports can also be exported to Excel.
As a Site Admin, go to Admin > Results.
Select the most current survey, then click Previous Period.
Select the mapped survey, then click Properties. Check the box "Show in Heatmap Comparisons"
Go to Reports > Heatmap.
Select a survey from the Survey dropdown then choose a demographic from the Demographics dropdown.
Select Previous Period in the Compare To dropdown.
Adding comment summaries and suggestions into the snapshot export provides Senior Leaders and Managers with valuable insights from employees, provides suggestions on how to remedy opportunities, and can help paint a picture for what the surveys scores show.
In order to export comment summaries, you'll first need to make sure you have run AI analysis for the demographic groups, ie: Senior Leaders or Managers. Please see to get started. If you prefer to watch a video on setting up AI and how to export:
The confidentiality of responses
The timeline for the survey and results
Team meetings
Posters in common areas
Digital signage


Go to Reports > Snapshot > Export > PowerPoint
Scroll to the bottom of the window, where you'll see Add AI Comment Summary. Note: If you don't see this section, then AI has not yet been run. If you do see the section but only see clock icons, it means that AI is still be queued and is not ready to report.
Check the individual boxes for sections or items where AI has been run or click Select All. A slide for strengths and opportunities and a slide for suggestions will be included at the end of each dimension. If you selected All Comments, those slides will appear at the bottom of the slide deck.
Go to Reports > Snapshot > Export > BulkPPT
Select a value from the demographics dropdown, then repeat steps 2 & 3 from the single export list above. Note: If you have not run AI for a demographic value, then the AI summary section will not show in the export dialog window.
To export snapshot report data in excel format, please follow these steps:
Go to Reports > Snapshot.
Click Export then click Excel.
An excel file will download with three sheets for dimension and item scores.
An AI summary slide allows you export ONLY the AI overview and AI comment summaries into one streamlined report. This allows the reader to view only what is relative to driving engagement and selected comment summaries.
Go to Snapshot > Export > AI Summary (Reports can be created in bulk as well)
If you choose to add AI comments select the comment summary options available. If you do not include comment summary, just the overview report will be generated.
For bulk report generation, ensure you select a demographic breakdown.
Engagement Overview
Engagement Score with comparison data selected
Recommend as great place to work survey item
Optimistic about the future survey item
Search by meaning uses semantic search to analyze the context of employee feedback. It identifies comments with similar meanings, even if the comments have different words or phrases. Use search by meaning to:
Identify key themes and trends: Quickly understand the most prevalent issues impacting engagement, retention, productivity etc.
Uncover hidden insights: Discover underlying reasons behind employee sentiment that may not be apparent through quantitative data alone.
Please note: This feature requires the use of AI. Please let your TalentMap Project Manager know if you would AI enabled for your Organization. Only users with permission to see comments will have access to comment meaning.
Reports > Comments. Within the search bar click the dropdown and select Meaning.
Enter one or more words into the search bar. This example uses the words "stress health". Comment count and word cloud will update to show dimension rank and most frequently used words associated with the search.
Export to PDF or Excel. Bulk export will automatically include comments with meaning by demographic group selected.
Key Driver Analysis is a powerful way to derive business value from your employee survey data. It helps you target improvement efforts to get the 'biggest bang for your buck’ by identifying the key leverage points for improving the engagement within your organization.
When creating key driver slides for the organization or for individual leaders, we strongly suggest focusing on the dimensions of your survey that have true outcomes. Within TalentMap's standard engagement survey there are three primary outcomes.
Organizational Engagement
Team Engagement
Intend to Stay (Item phrased: How likely are you to accept a position with another employer within the next 12 months?)
You do not have to use all three of these measures, and in many cases Organizational Engagement / Engagement will suffice when prioritizing actions to drive change. We recommend speaking with your Consultant on best outcomes to measure before producing reports for staff.
Click Reports > Snapshot. Choose the survey you wish to run reports for, then click Export. Note: You may apply filters to generate key driver slides for a specific sub-group (ex. you wish to see departments within a Division). Also note, when running filters, the minimum number of respondents required to run key driver analysis is 30.
Scroll to the bottom of the window, then use the dropdown list to select a survey dimension or item. Note: Click the dimension text to add the overall dimension scores or select an individual item. When adding an item, click the arrow next to the dimension text to show the items within that dimension.
Click the + button again to add multiple key driver outcomes. Use the column label to update the title that will appear in the export.
Delete individual selections by clicking the garbage can, or click Clear All in the top right of the window to clear all selections.
When creating the key driver slide shown above, additional slides to help understand the report and dimension correlations per key driver will automatically be generated automatically.
Sifting through mountains of employee feedback to find actionable insights can be overwhelming. TalentMap's Ask feature allows you to directly ask questions about your employee comments, using natural language. With question and answer insights, you can:
Distinguish comment themes by dimension or question.
Identify and address the root causes of employee turnover
Develop targeted initiatives to improve engagement within specific teams or demographics
TalentMap uses AI to generate a summary of verbatim comments as well as possible suggestions to improve based on feedback. The summary includes:
Most Common Strengths
Most Common Opportunities
Possible Suggestions to Improve
Please note: The use of AI requires organization approval. Please let your TalentMap Project Manager know if you would like this feature enabled. Only users with permission to see comments will have access to AI summary and suggestions.
Intend to stay survey item
Strongest Drivers of Engagement (30 responses or more)
The three strongest drivers of engagement
Doing Well
Up to three survey items that most strongly correlate to engagement and have POSITIVE comparative or favourable scores.
Look to Improve
Up to three survey items that most strongly correlate to engagement and have NEGATIVE comparative or favourable scores.


Make informed decisions about your workforce, based on real employee feedback
Please note: This feature requires the use of AI. Please let your TalentMap Project Manager know if you would AI enabled for your Organization. Only users with permission to see comments will have access to comment meaning.
Before using this tool, think of some questions you would like to ask or have received from other members in the organization. It is important to understand that the more detailed the question, the better the answer. Here are some question examples to help get you thinking.
Please describe the themes relating to these comments in ranked order.
Is senior management doing a good job at accomplishing goals through employee trust and confidence?
Summarize and give examples of comments related to how leaders prevent, manage, and resolve “people problems” and interpersonal conflict.
Summarize and give examples of comments that describe how the organization hinders the performance of direct managers.
Provide a summary and examples of comments that mention problems that cannot be corrected at lower levels of management but rather require the senior executives to lead improvements.
From the comments provided, what are actions or situations that make employees feel that it is not safe to speak up, offer suggestions, or provide an alternative point of view?
Does the organization do a good job at empowering managers or supervisors to do their job well?
What are the top 3 most important issues that senior management should address to help with employee retention?
Which comments are considered most concerning and should be acted on immediately to improve our customer experience?
Reports > Comments, then click on the Ask tab. At the bottom right, type your question and press enter. Ask questions within All Comments or switch to a single dimension to filter answer within a dimension.
You can continue to ask questions and treat the thread as a conversation, or click clear to start a new conversation. Copy and paste your conversation at any time into your document of choice. Export is not currently supported at this time.
You can also filter by demographics to provide even more targeted insights. When switching between different demographic filters all previous conversations are saved.
If you apply a word in the search bar, it only highlight words that appear in the Ask section and does not filter out comments.
Overall (the entire organization)
Filtered Results (from any filter created in the top rights corner)
Previous Period (if applicable)
Compare against another demographic group from the participant information file.
Click the percentage icon to view the percent favourable score instead of the delta value. Click the swap axis icon to show demographic groups along the Y axis.
To view the question scores, open one of the dimensions by clicking the dropdown arrow next to the dimension, or use the expand / collapse all buttons in the left corner of the heatmap to view all questions.
Click Filters in the top right corner. Available data will be displayed in the center column where you can choose between Demographic, Survey Item and Date. Once a field is selected, you will see the available filter options in the right column. Check the boxes for data you would like to filter, then click OK.
You can apply multiple filters by clicking the + button in the left column.
Compare results to other demographics by clicking the Compare To dropdown.
Click Export in the top right corner. This will save the Heatmap to an Excel file.
When viewing the Heatmap in Excel, you can view only Dimension scores or click on the second sheet at the bottom of the file to view Dimension and Item scores.
Any demographic and/or filter details will appear in cell A1 on both Excel sheets.
IMPORTANT: In order to maintain comment accuracy, AI analysis will be deleted from reports if:
Any update is made to the participant information file (Except if adding a reporting new column).
New survey responses are received.
Reports > Comments. Click Run AI next to Export.
A pop-up window will appear, which allows you to run AI for comments within the entire organization or for a specific demographic group (Division, Department etc.). To use this window
In the dropdown, leave overall or select a demographic.
Select which dimensions to include or click Select All. Note: If there are multiple comment questions within a dimension, click the dropdown next to the dimension to see those questions.
Click OK. Compass will start to bulk prepare the comment analysis.
You can track the progress by clicking Status in the top left corner, then AI Summary. You will also receive an email once complete. Please note: bulk export to PowerPoint is not yet available for this feature.
On the Comment page, an AI icon will show for dimensions or questions that are complete. A clock icon will show when something is in the queue.
Use Filters to generate reports for Senior Leaders or Managers. Please Note: this feature does not work with survey items or date filters.
Click Export to generate PowerPoint slides or click Copy to Clipboard to paste into a preferred format.
If you need to specify a specific group within a parent demographic, apply a page filter and then click Run AI. In the example below, we've selected Region as the filter and then run AI analysis for the divisions within that region.
TalentMap suggests exporting key driver dimensions as well as the final message summary and Senior Leadership or Immediate Management summaries for Senior Leaders and Managers to assist with sharing of survey analysis and action planning.
Please see this article on how to include AI comment summaries in a single or bulk snapshot report or watch the video which explains the end-to-end process.


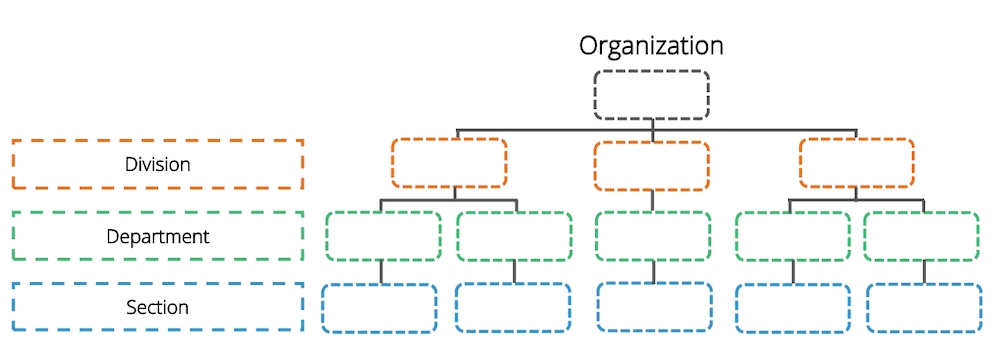
Click Reports > Comments.
Select a survey from the Survey Dropdown in the top left.
Comments are sorted by default to display the highest to lowest number of comments within a dimension. Click through the dimension headers from the survey to show comments that were made for each section. When clicking on a Dimension, the number of comments in the right column will update to reflect the number of comments per section. Click the expand collapse icons to show the comment item titles. Click the sort arrows to sort by Dimension or Comment Count.
Comments are shuffled with Compass as they are received so that it is harder to identify respondents.
Word cloud displays the top 50 most commonly used words from the survey's comments. The word cloud will adjust the most commonly used words when clicking through all comments, or dimensions or items.
Hover over a word to see how many comments are associated with the word.
Click on a word to add it to the search bar and filter comments that only use the word. You will notice that the word cloud updates to show words associated with the selected word. Dimension and comment counts also update to show where the word is used per dimension. Click x in the search bar to remove the word and reset the number of comments displayed.
To search for a specific word, click the Search bar then enter a search value. The total comments and comments per dimension will update based on your criteria.
To filter by demographic groups or survey items, click Filters in top right corner. Available data will be displayed in the center column where you can choose between Demographic, Survey Item, Dimension Score and Date. Once a field is selected, you will see the available filter options in the right column. Check the boxes for data you would like to filter, then click OK.
When exporting comments, you may choose All Comments or an individual dimension from the table above word cloud. Click Export in the top right corner. Enter a title for the file and choose whether to include a word cloud per question.
The first page of the export displays a table of contents and any search criteria that was applied. Click on a dimension title to jump to the comments within that dimension.
Click table of contents in the footer of a page to go back to the table of contents.