Loading...
Loading...
Loading...
Loading...
Loading...
Loading...
Loading...
Loading...
Loading...
Loading...
Loading...
Loading...
Loading...
Loading...
Loading...
Loading...
Loading...
Loading...
Loading...
Loading...
Loading...
Loading...
Loading...
Demographic report labels are used when filtering data and appear in all reports. To edit your demographic report labels, please follow these steps.
Click Admin, then click the title of the survey you want to update.
Click the Report Label cell(s) and type in the desired text. Labels will update across filters, comparisons and all reports.

Before results are made available for report generation and visible to online report viewers, you can setup report data and assign access while a survey is live. This allows for a much faster turnaroud once the survey closes. As a survey admin, it is important review:
Previous Period (if applicable)
Once you are ready to enable the report. Go to Admin > General and click Available for Reporting. Please note: this feature is only available to Site Admins who have access to design and deploy surveys. For clients using a managed service, your Project Manager will enable the report once the setup is complete.
To update the name of your survey in Compass, please follow these steps.
From the Compass dashboard, click Admin, then click the survey name you wish to change.
Within the General tab, highlight the survey name text and replace with a desired name. The survey name will update immediately across all reports.
Within survey items, you can change how the survey response data is displayed when looking at reports. Changes that you can make include:
Removing a question(s) from reports
Removing a custom question score from the overall dimension score
Hiding potentially sensitive questions from Restricted Report Viewers
By default, any survey that uses nominal data (ex: checkbox or demographic questions) will be sorted from highest to lowest response count. These nominal values are available within the snapshot report for the:
Webpapge
PowerPoint export
Excel export
You have the option to update the sort order of nominal data to follow the survey order. To do so, please follow these steps.
Converting a survey item to a filterable demographic field allows you to take questions from a survey and add them as a demographic value that can be measured and filtered within heatmaps, snapshots, correlations and comment reports. To convert a survey item, please follow these steps:
Click Admin, then the survey title name.
Click Survey Items, select the item you wish to convert, then click Fields.


Changing a scale to show as nominal data, and
Inverting a scale
To access the survey scale option, please follow these steps:
From the Compass dashboard, click Admin then Results. Please Note: the Admin option is only available to your organizations Compass administrator(s).
Click on the title of the survey you would like to make changes to.
Click Survey Items in the left column.
Under Default Scales, you can change the scale type for all questions using the same scale within the questionnaire.
To make changes to an individual item, click on the question within a dimension. To change the reporting options, choose one of the radio button option and/or checkbox. To change the scale click Override Default and update the scale using the dropdown list.
When making a change from the default setting, a flag will appear to the right of a Scale or Item. Changes will be automatically updated for reporting.
Admin > Survey Title
Within the General tab, click the Nominal Data Sort and select Survey order.
You will see these changes take effect immediately within the snapshot report and exports.
Click on the text and add a demographic report label that makes sense for your reporting purposes. Click Add to Demographics. Note: If you have translated survey questions, you can add the translated report label.
Once added, you will be able to use these demographic labels within filters and demographic dropdowns across the reporting platform.


If you would like to add members of your team or leaders to Compass to view reports, please follow the steps below. Note: This feature is only available to Admin licensed users.
Click on Admin > Users > Add User.
Enter the persons Full Name (First/Last) and email address.
Restricted User
If Checked - User will only be able to see their area of responsibility (Restricted Report Viewer - Ideal for Leaders and Managers)
If Unchecked - User will be able to see all surveys and reports (Report Viewer - Ideal for members of HR)
Check individual report options.
Remove Filter Similarity Warning
If Checked - Removes an algorithm that protects confidentiality that can sometimes affect the ability to filter within small demographic groupings. Survey confidentiality threshold for responses (typically set to 5) will still apply.
Click Save. An email invite will be sent to the user to verify their account.
To add Previous Period (trend) data to your survey, please follow these steps:
From the Compass dashboard, click Admin then Results. *Note the Admin option is only available to your organizations Compass administrator(s).
Click on the title of the survey you would like to add previous period data to.
Click Previous Period in the left column.
Choose the survey that you will map data to from the dropdown list and add a mapping label (typically the year the last survey was done). Click AutoMap then Continue. Automap will do its best to match questions and demographic data from one survey to another.
Once loaded, you will be able to update the mapping of Items (survey dimensions and questions) and Demographics (data from your participant information file). To edit an Item or Demographic, click the dropdown icon and then pencil icon and choose which field(s) will be placed for the previous period survey.
The Properties tab allows you to update the mapping label, hide previous period data from reports, update the reporting column order (if you have created two previous periods) and delete the mapping period entirely.
To add a second previous period, click Add Second Mapping, and then repeat steps 4 & 5.
You can switch between the two previous period surveys by clicking the dropdown just below the survey title.
Compass users can login using their Microsoft 365 login credentials. Only users who have been given access to Compass will be able to sign in.
Consent on Behalf of the Organization
If you prefer to not have each user accept the Microsoft permission request, you can have a Microsoft Admin user consent permission for the organization. To do so please follow these steps.
In Compass, go to Admin > Users > Create a new user who's email has Microsoft Admin enabled. Note: you can remove the user after by deactivating them if you do not need them to login to Compass
The new user will go to , then click Continue with Microsoft Account.
Click "Consent on behalf of your organization" then Accept
Now new users to Compass will not have to accept the Microsoft permission request.
There are three types of users within the Compass Platform:
Restricted Report Viewer - Access to assigned reports for a specific demographic group. Example user: Executive, Manager or HR Business Partner.
Report Viewer - Access to all report data. Example user: HR Staff or CEO.
Site Admin - Access to all report data, report configuration and user access / assignment: Example User: Survey Lead or CHRO.
A Site Admin user can only be created by TalentMap. Site Admins can create their own Report & Restricted Report Viewers from the admin page. .
To update email or demographic information for a participant while a survey is live, please follow these steps.
Admin > Surveys > click on the Survey Title > Participants
Click inside a cell that you want to edit. If editing an email address, the change will update within the email campaign. If your participant list requires multiple edits, or you need to add new participant(s), we recommend editing the .csv file and then re-importing to keep both the file and participant webpage current.
To remove participants from an email campaign, please follow these steps:
Admin > Surveys > click on the Survey Title > Participants
Click the garbage can next to the participants email. NOTE: this will remove all associated data including response data.
If you are removing several participants and / or plan on making further changes, we recommend removing them from the
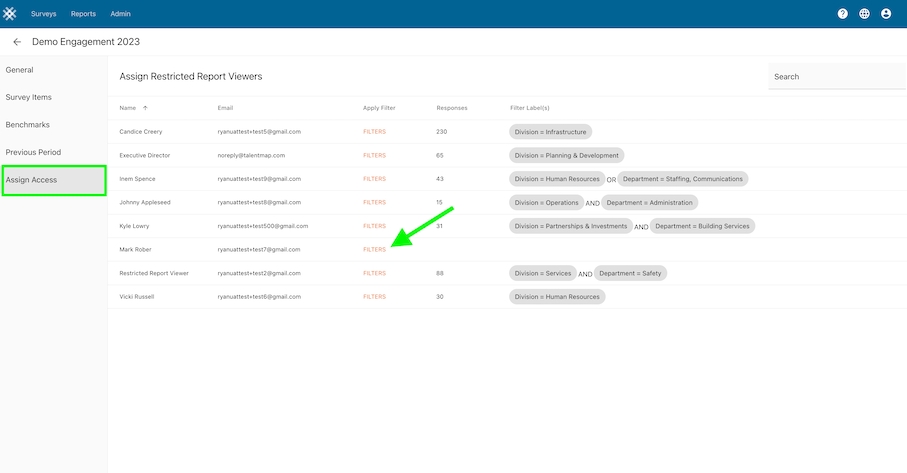
As a Compass Site Admin, you can add Restricted Report Viewers to access and filter reports ONLY for their area of responsibility ex. Division, Department etc. These users cannot see reports or data for other areas of the organization.
By default, a Restricted Report Viewer can:
View, filter and download Snapshot, Dashboards & Heatmap Reports
Compare Snapshot report data the Organization Overall
You can assign additional report when creating or editing a user. See . Report options include:


Response Rates
Comments (with or without AI)
Insights
Correlations
To create and assign a Restricted Report Viewer, please follow these steps:
As a Site Admin, go to Admin > Users > Add Users.
Enter the persons Full Name (First/Last) and email address.
Check "Can view comments" only if you want the user to view verbatim comments for their demographic group.
Click Save. An email invite will be sent to the user to verify their account.
As a Site Admin, go to Admin > Results > Survey Name > Assign Access.
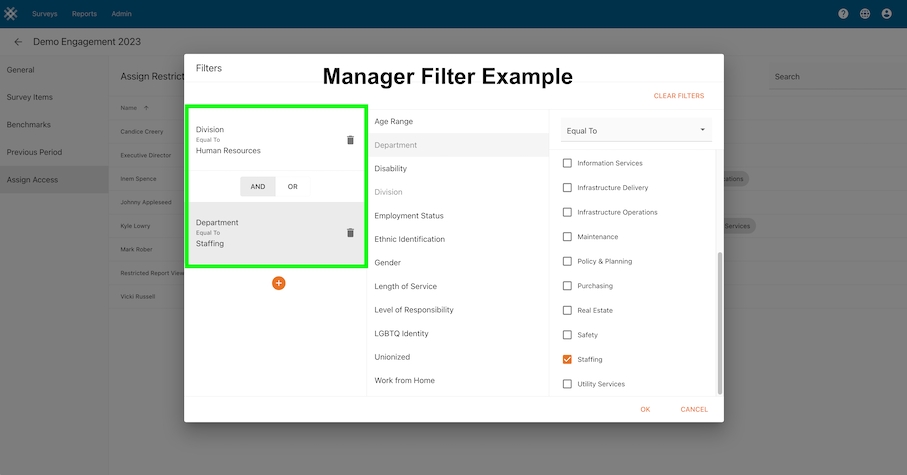
Click Filters > select a demographic then choose the appropriate group(s).
Filter Examples
Executive: Division = Human Resources
Manager: Division = Human Resources AND Department = Staffing
Click OK
Once OK is clicked, the user will immediately have access to the report data. You may re-click Filters to edit a users filtered group(s) or click Clear Filters to remove ac


To add Benchmark data to your survey, please follow these steps:
From the Compass dashboard, click Admin then Results. Please Note: the Admin option is only available to your organizations Compass administrator(s).
Click on the title of the survey you would like add benchmark data to.
Click Benchmarks in the left column.
Click AutoMap then Continue. Automap will do its best to match items to TalentMap's benchmarked items. Click the Expand All icon in the top right to open the list of all items to see if the survey is mapped correctly.
Items that have not been mapped will appear with a red background. To manually map an item, click the pencil icon to the right, then choose the correct item from the dimension dropdown list and click OK.
To remove a benchmark mapping, click the pencil, then click Clear Mapping and OK.
Benchmark data will appear in Snapshot and Dashboard reports.
Dashboards are great for displaying the most important aspects of the survey data or can provide "at a glance" metrics for ongoing surveys.
This article explains how the dashboard editor tool works in Compass. It is important to note that before configuring a dashboard you should first consider what story you want to tell with the data. We strongly suggest speaking with your project manager or consultant before deploying a dashboard for your survey results.
Go to Admin > Results > Survey Title > Dashboard.
Create a title for the dashboard which will appear in the export and on the dashboard webpage.
Click on one of the cell types in the second column. Drag and drop a cell type anywhere on the dashboard editor grid.
Click the pencil icon within a cell, then select the size, survey dimension, title etc. Click the trashcan on a cell to remove it from the editor grid.
Add another cell and repeat step 4.
Click Review to view a powerpoint export of the results.
When a cell has a dashed outline that means no content has been added. Click the pencil icon to edit the cell.
When a cell is has a red outline that means that it is overlapping or on top of another cell. Drag the cell within the grid until it has a grey outline to avoid overlap. Note: Cells that overlap will not show in the dashboard webpage or export.
When designing a dashboard it is helpful to have Compass open on two screens. Screen one showing the dashboard editor page and screen two with the dashboard webpage. Add an update to the editor page then refresh the webpage to view the result.


Snapshot customization allows Compass Site Admins to add and / or replace static slides within the snapshot report for a survey. Changes to static slides will be made available to all users and all snapshot report exports.
Go to Admin > click the Survey Title > click Snapshot along the left pane.
You will see areas of the report (such as cover slide, understanding results slide etc.) These are sections of the report where static slides can be replaced. Sections that do not include default static slides cannot be removed.
Create a .pptx slide using the . Using this template will help avoid any conflict between master slide layouts. You can add text, images, links etc. to the slides. Note: If you are adding your own cover slide, the default title and subtitle will be removed.
Attach file(s) to the areas you wish to change. Any section that does not have a new file attached will show the default TalentMap slides.
Once the file(s) are attached, click Save. Then click Preview to create a sample export of the snapshot report.
To make changes, click the trashcan next to a section and reupload a file or click Clear All to start over. Continue to preview the results until you are satisfied with the final report layout.


Site Admins can manage what survey(s) and precise groups Restricted Users can access. For a more detailed article on creating and assigning Restricted Users, click here.
As a Site Admin, go to Admin > Results > Survey Name > Assign Access.
Click Filters > select a demographic then choose the appropriate group(s).
Filter Examples
Executive: Division = Human Resources
Manager: Division = Human Resources AND Department = Staffing
Click OK
Once OK is clicked, the user will immediately have access to the report data. You may re-click Filters to edit a users filtered group(s) or click Clear Filters to remove access.