Participant Information File
What is a PIF?
The participant information file (PIF) is an excel file that provides TalentMap with all your participant-information needed to deploy your survey and group/analyze the data collected. We often survey with the hope of understanding where things are going well, as well as where to improve. Demographics allow you to unpack your overall results and examine meaningful differences between groups of employees.
Demographics that identify groups that score favourably can help uncover best practices that can be implemented in other areas, on top of uncovering opportunity areas that require immediate attention.
Demographics help you narrow in on local differences - such as region, department, or team manager - helping to ensure consistency across the business.
Confidentiality: Is represented by the reporting threshold. The higher the threshold the more confident respondents can be that their responses will not be linked back to themselves as individuals. The threshold can be set as low as 5 respondents or as high as you wish – the higher the better. While creating the PIF, use this threshold to guide your demographic grouping decisions.
Draft Your PIF
Each row represents one participant and must have an email address (work or home). Work emails are best – include whenever possible. Each column represents a demographic category we will use to filter the data. There are no limits to the number of columns you can include. However only include data you will use or need. All reports will use the language provided here, so ensure:
That none are longer then 35 characters. If so, shorten them to ensure they will not be cut off in reports.
The case is consistent (sentence case looks best in reports)
There are no acronyms
Everything is spelt correctly
Don’t include the following demographic data:
SIN number
Birth date
Hire date
Record id, employee id
First and last name of employees
Any demographic unique to the individual
Demographics that have less than 5 respondents – demographics with less than 5 should be merged with another group, left blank or merged into an ‘Other’ category.
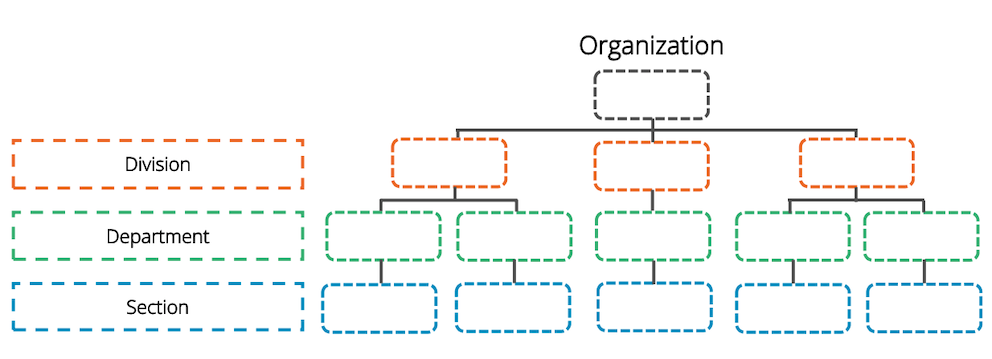
If you can’t report on it or don’t need to, leave it out. Include less specific data like: age ranges (i.e., Under 25, 25-34 years, 35-44 years, 45-54 years, 55+ years) and, length of service ranges (i.e., Under 1 year, 1-4 years, 5-9 years, 10-19 years, 20+ years). When adding your organizations hierarchy as demographics, consider how your organization is structured. This will allow for best roll-up reporting for managers and executives.

Run Quality Control Checks
Create a pivot table and analyze your groupings. Keep your groupings (number of participants in each demographic option) above your minimum reporting threshold. Ensure there are NO:
Duplicate or missing emails,
Formulas,
Filters, or hidden columns,
Individually identifying information,
Acronyms
Ensure that your highest-level reporting is represented in a column.
Supply to Your Project Manager
Your PM will also run quality control checks on the file and will reach back to you to discuss. Your PM may also schedule a meeting with you to review PIF issues or changes that are needed. Once the checks are done and changes are made, you will provide the FINAL version of the PIF to your PM.
Last updated
Was this helpful?